

Services
Expert Consulting & Training in Spatial Biology
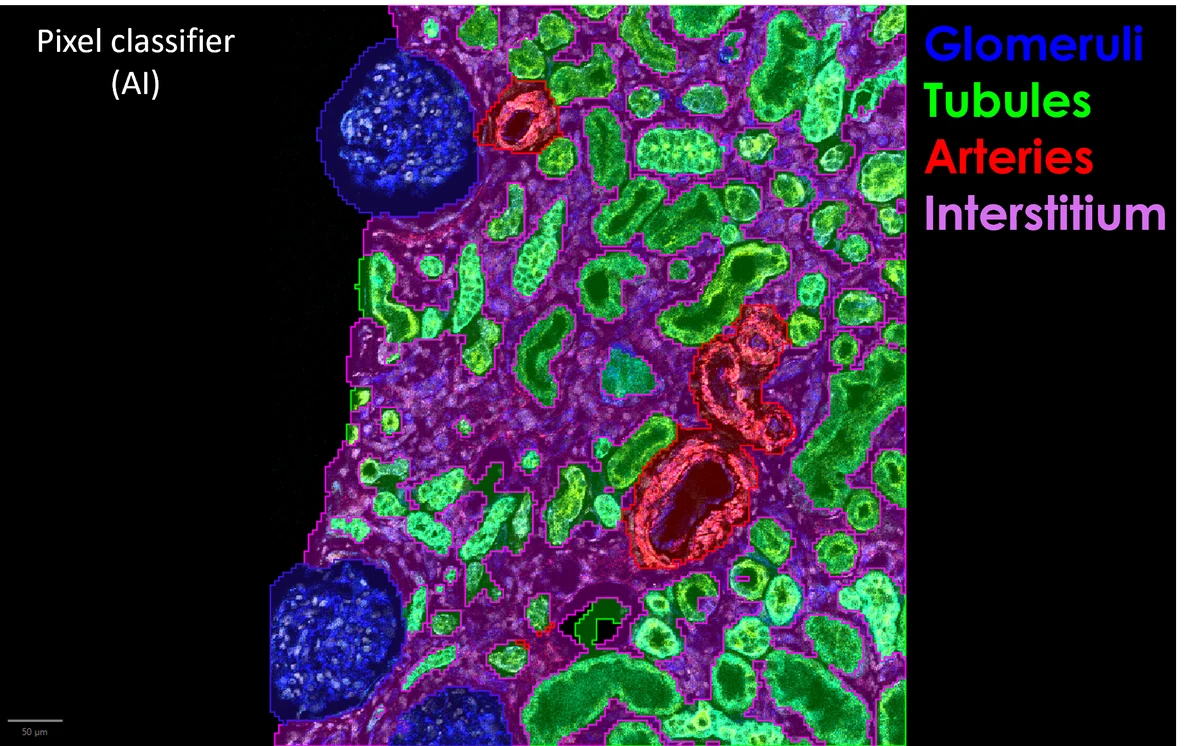
Image Analysis Services
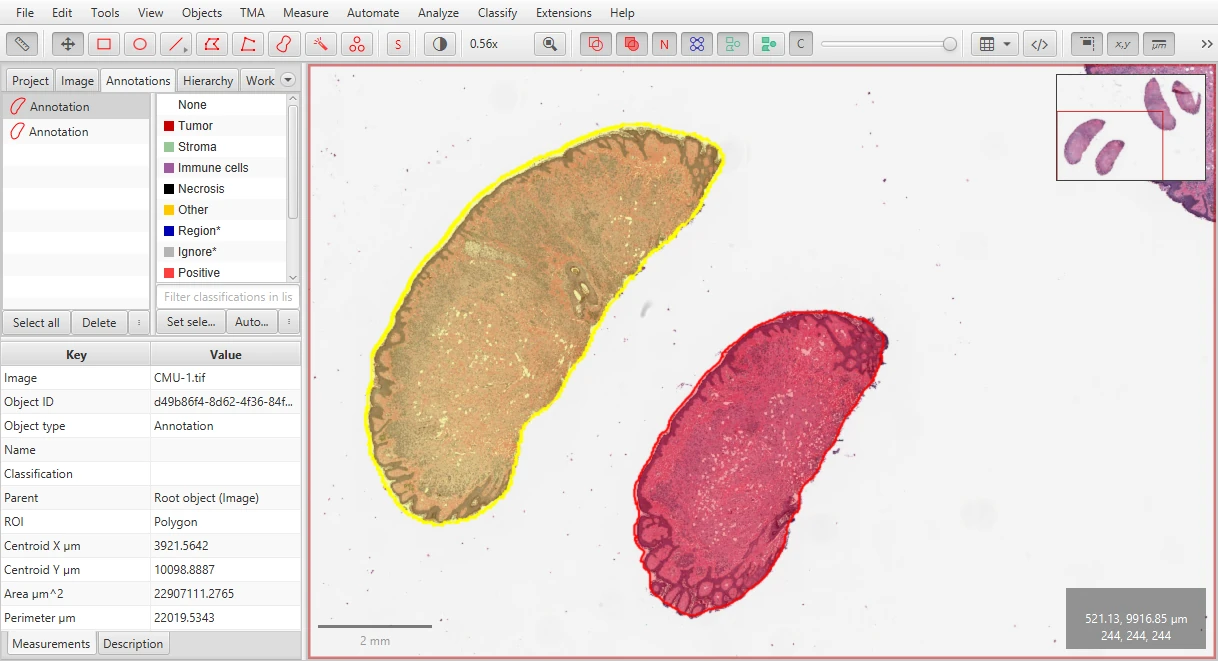
Training in Spatial Biology & Open-Source Tools
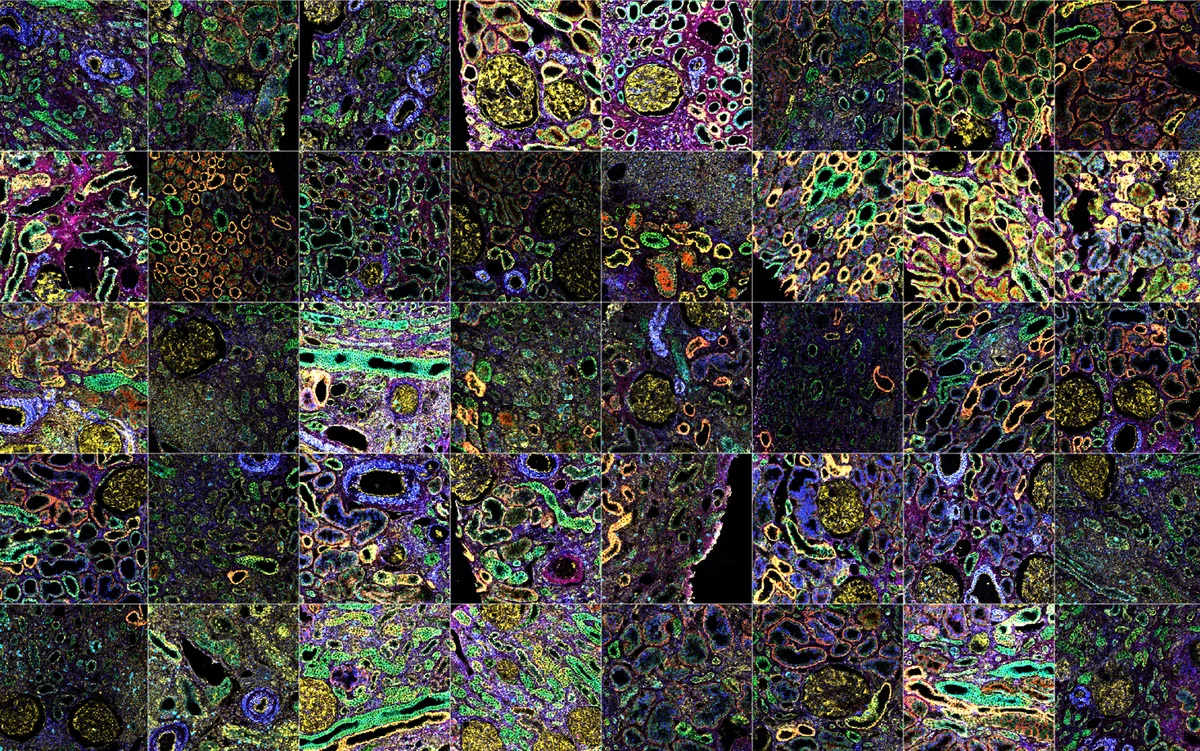
Spatial Multiomics Data Analysis & Workflow Development
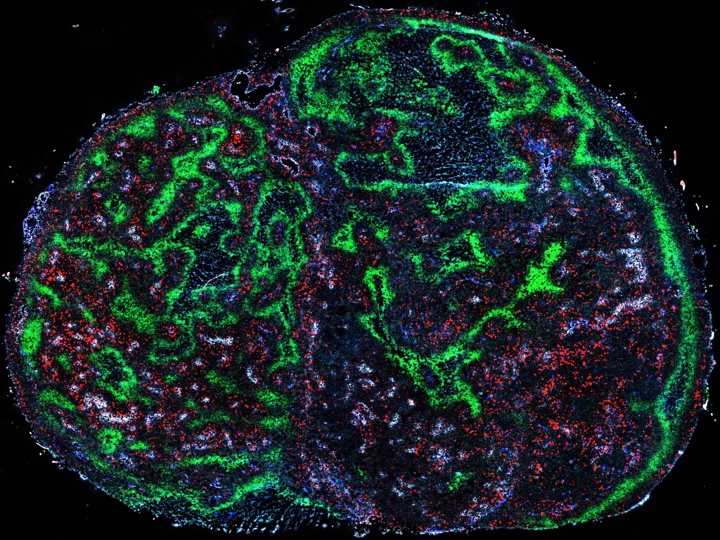
Digital Pathology & Histology Consulting
Workflow Optimization & Computational Pipeline Development
Scientific Writing & Grant Consulting
In action
See what your tissue data can become
Before & after
From raw image to AI cell phenotypes
Drag the slider to compare a raw multiplexed immunofluorescence image of tonsil tissue with the same region after AI-driven cell segmentation and phenotyping. Every cell is outlined, measured and classified.
Discuss your images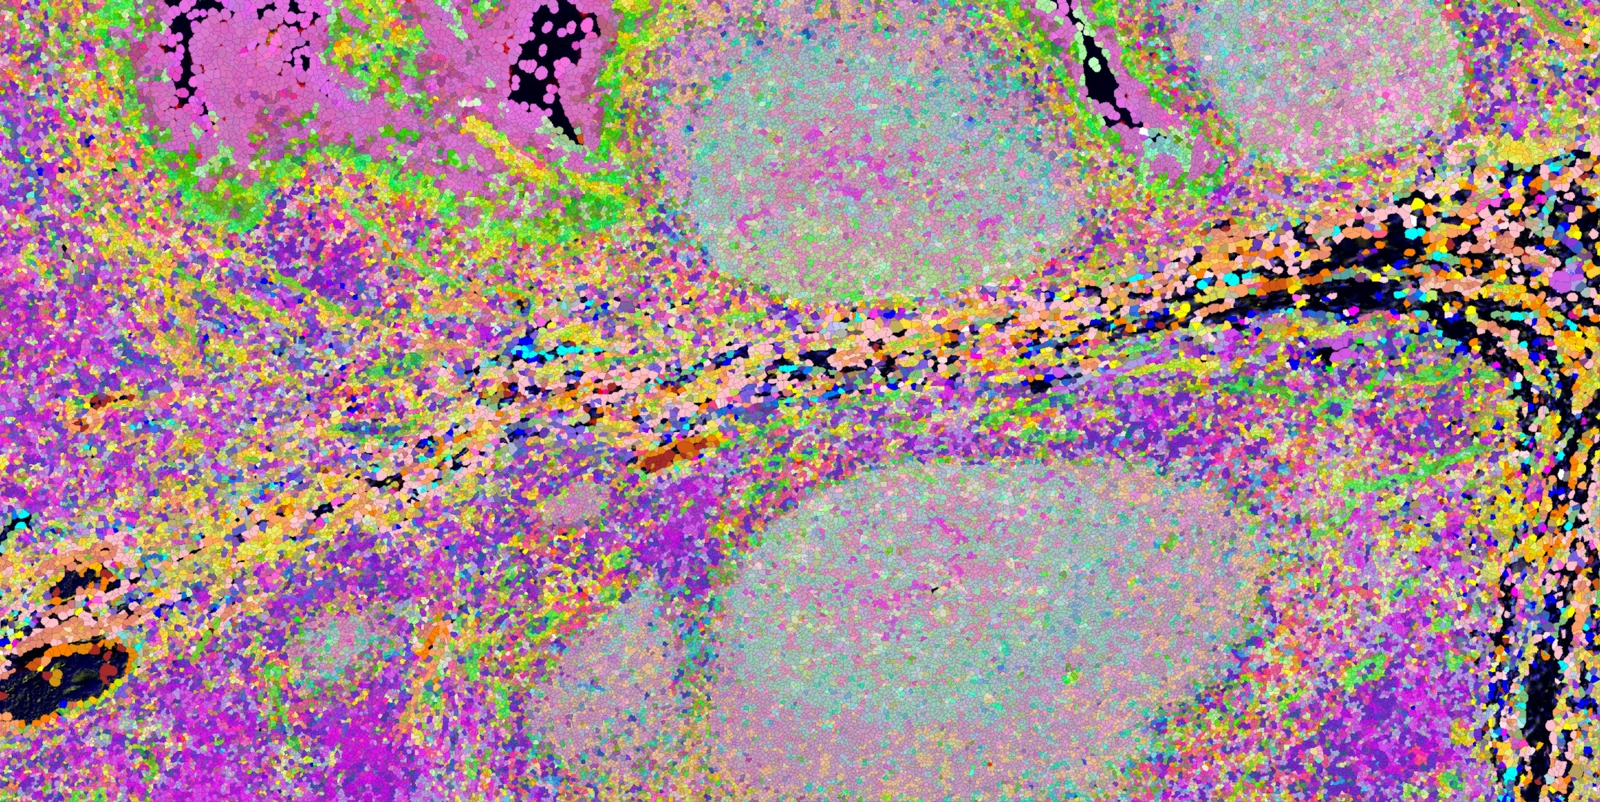
Marker channel viewer
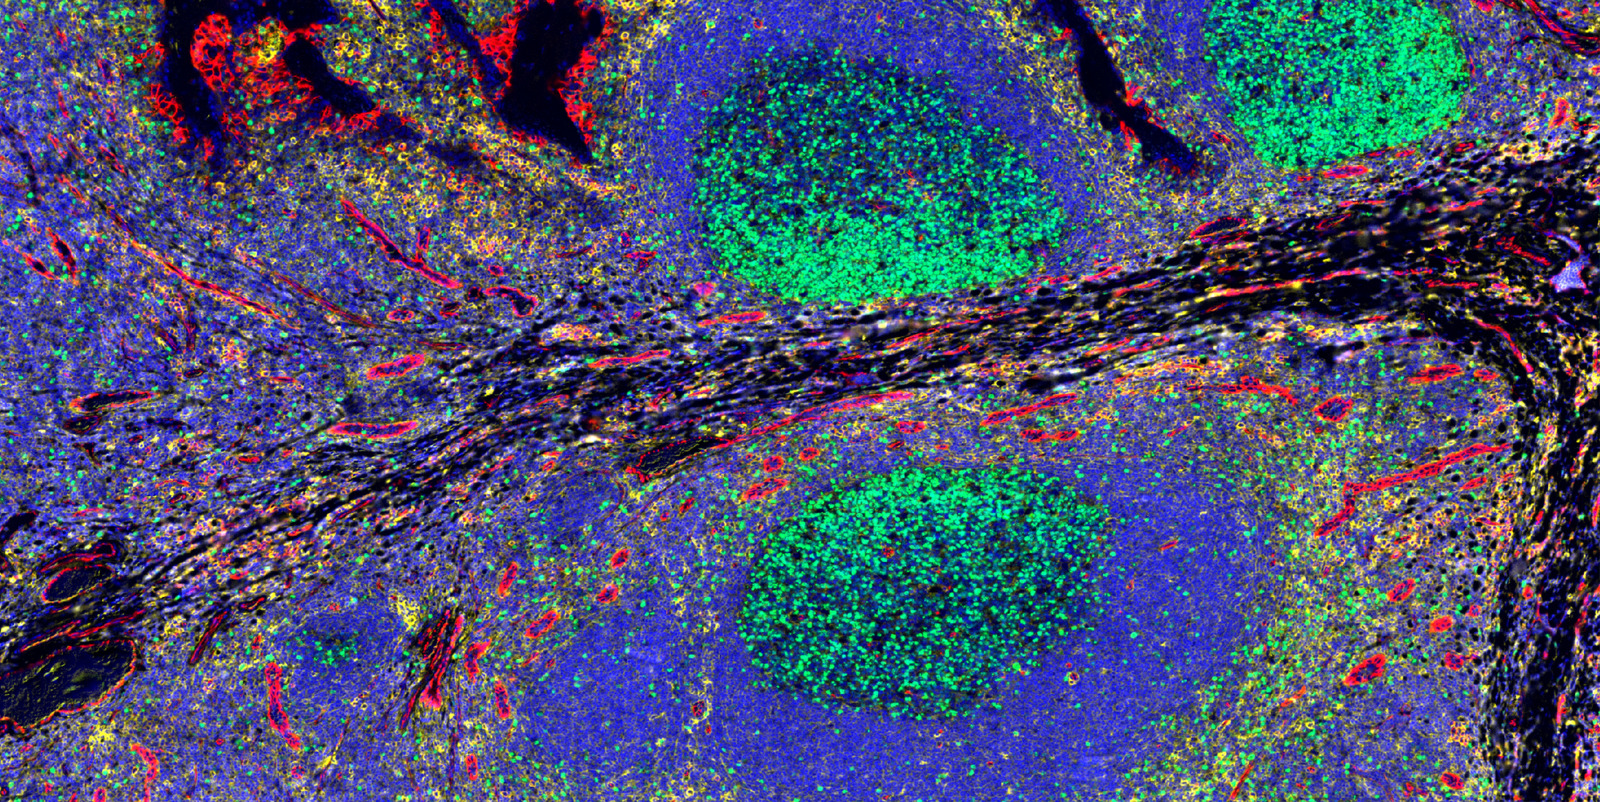
Explore a multiplexed tissue, one marker at a time
Switch the markers of a multiplexed immunofluorescence tonsil image on and off. Each channel was separated from the original composite, so this is the real signal. Switch the page to BF to see the same markers simulated as brightfield chromogens.
Technologies we analyze
What each platform is good for, what to plan for, and how we can help you get answers from it.
Frequently asked questions
Which spatial biology platforms and data types do you work with?
Spatial transcriptomics from 10x Xenium, Visium and Visium HD, NanoString / Bruker CosMx and GeoMx DSP, Vizgen MERSCOPE and STOmics; multiplex immunofluorescence and multiplexed IHC from CODEX / PhenoCycler, PhenoImager (Vectra Polaris, Opal), COMET, Orion and MACSima; imaging mass cytometry (IMC) and MIBI; MALDI and DESI mass spectrometry imaging; and brightfield H&E and IHC whole-slide images. Data and results already generated in HALO, Visiopharm or inForm can be picked up and extended too. If your platform is not listed, ask: most imaging and spatial omics data can be brought into an open, reproducible workflow.
Can you analyze spatial data we have already generated?
Yes. Many projects start with images or spatial omics data already in hand, sometimes partly analyzed. We review the data and your question, then build the analysis from there: quality control, cell segmentation, phenotyping, quantification and spatial statistics.
What does a typical image analysis project deliver?
Depending on scope: segmented cells and tissue regions, cell phenotypes, counts and densities, marker co-expression, spatial metrics such as neighbourhoods, distances and colocalization, publication-quality figures, and the QuPath or Python scripts so the analysis is reproducible in your lab.
Do you offer QuPath training?
Yes. Training ranges from one-on-one sessions to team workshops, covering annotation, cell detection with StarDist, pixel and object classifiers, multiplex phenotyping, scripting and batch processing. Free tutorials are also available on the Educational Resources page.
Can you build a custom AI model for our tissue images?
Yes. We develop deep learning models for cell and tissue segmentation and classification, and AI-assisted quantification for brightfield and multiplexed images, designed to run in open-source tools so you are not tied to commercial software licences.
Do you work with biotech, pharma and CROs as well as academic labs?
Yes. We work with academic labs, core facilities, biotech and pharmaceutical companies, CROs and pathology teams. Confidentiality agreements can be put in place before any data is shared.
Can you help with manuscripts, figures and grant applications?
Yes. Support includes methods sections, figure design and data visualization, responses to reviewers, and the computational aims of grant applications.
How does pricing work, and how do we start?
Every project begins with a free consultation to understand your data, question and timeline. After that you receive a scoped proposal. Send a message to get started.
Ready to elevate your spatial biology research? Let's collaborate.
Share your modality, project stage, dataset question, or analysis challenge. Spatial Multiomics Consulting can help define the right analytical next step.