Case studies

Spatial analysis in practice

Examples from published and presented work: the question, how the tissue data were analyzed, and what came out of it.

Pre- and post-treatment multiplex immunofluorescence images with marker quantification

Multiplex immunofluorescence · QuPath

Multiplex immunofluorescence as a clinical-trial endpoint

Frontiers in Immunology, 2025

Challenge
A pilot clinical trial of neoadjuvant imiquimod, a Toll-like receptor 7 agonist, in early-stage oral cancer needed a quantitative, tissue-based primary endpoint.
Approach
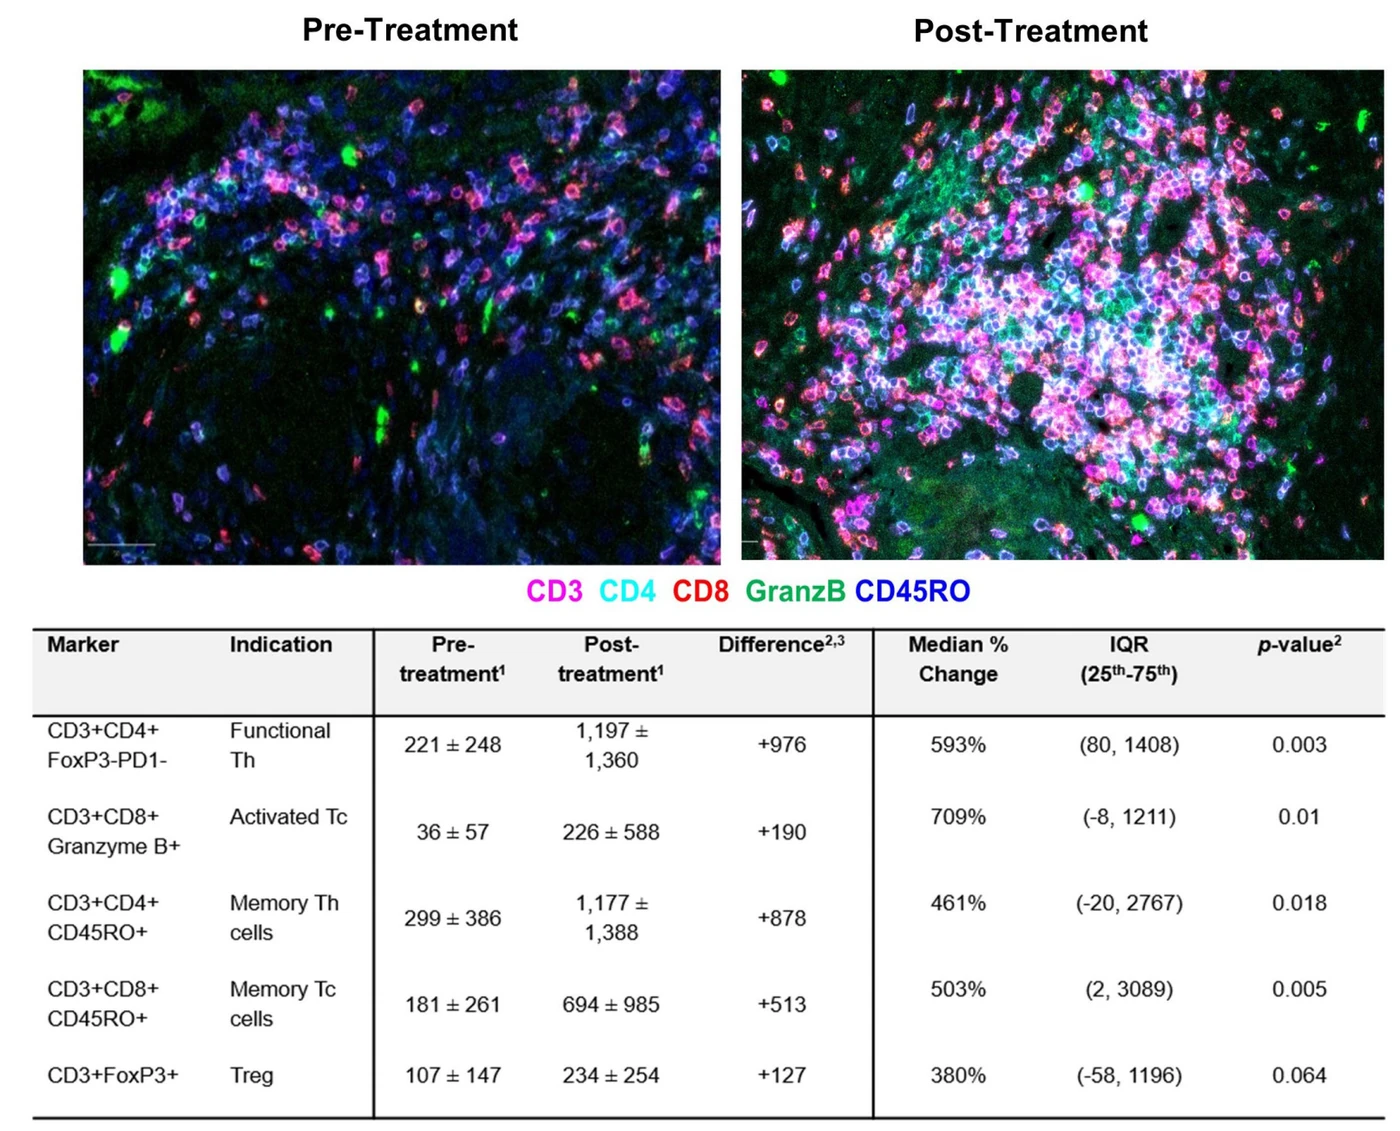
Pre- and post-treatment biopsies were analyzed in QuPath: StarDist cell segmentation, marker-based classification of tumour and immune populations, tumour cell counts, and spatial metrics of immune-cell proximity to tumour cells.
Outcome
The analysis quantified treatment response and showed significant increases in cytotoxic and helper T cells after treatment, profiling how the tumour microenvironment changed.
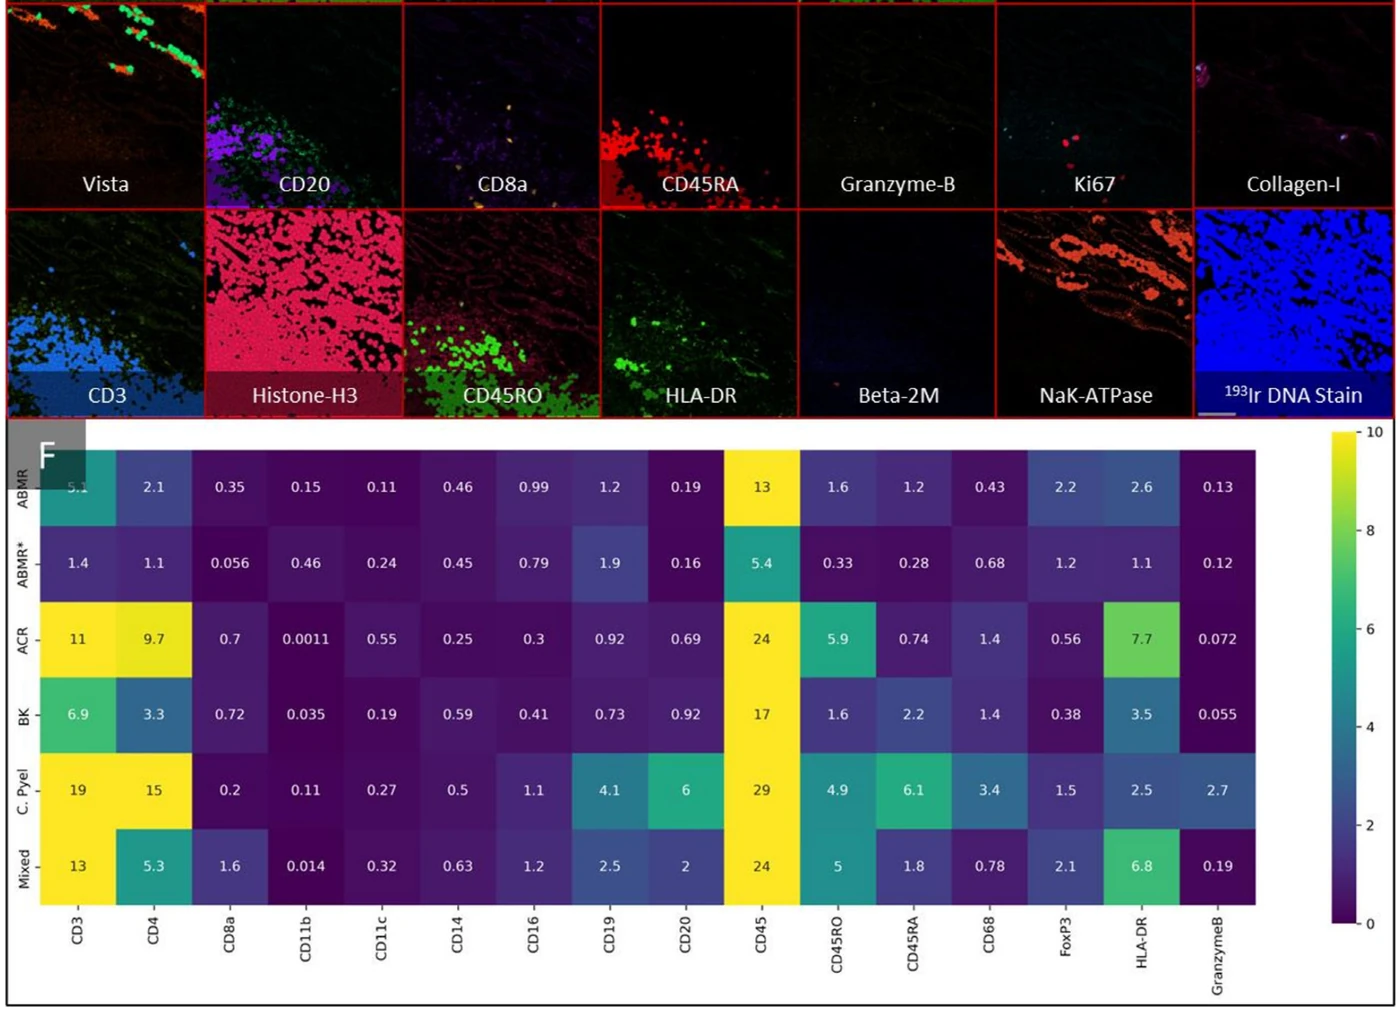
Imaging mass cytometry of kidney allograft tissue with immune cell maps

Imaging mass cytometry · QuPath · Python

The single-cell immune landscape of kidney transplant inflammation

American Journal of Transplantation, 2023

Challenge
Kidney allograft inflammation is assessed largely by eye. The goal was a quantitative, single-cell picture of the immune cells involved and how they are organized.
Approach
247 imaging mass cytometry images from 32 biopsies, with a 28-marker panel, were analyzed in QuPath and Python: StarDist segmentation, marker thresholding and classification, tissue compartment annotation (glomeruli, tubules) and downstream clustering and machine learning.
Outcome
Around 900,000 single cells were profiled. Spatial analysis identified immune clustering patterns linked to rejection phenotypes, contributing to a tissue-based classifier.
Imaging mass cytometry of kidney biopsies showing immune cell phenotypes

Imaging mass cytometry · spatial phenotyping

Telling immunotherapy-related kidney injury apart

Kidney International Reports, 2022

Challenge
Acute kidney injury caused by immune checkpoint inhibitors is hard to distinguish from other causes without an invasive biopsy, and its immune biology was poorly characterized.
Approach
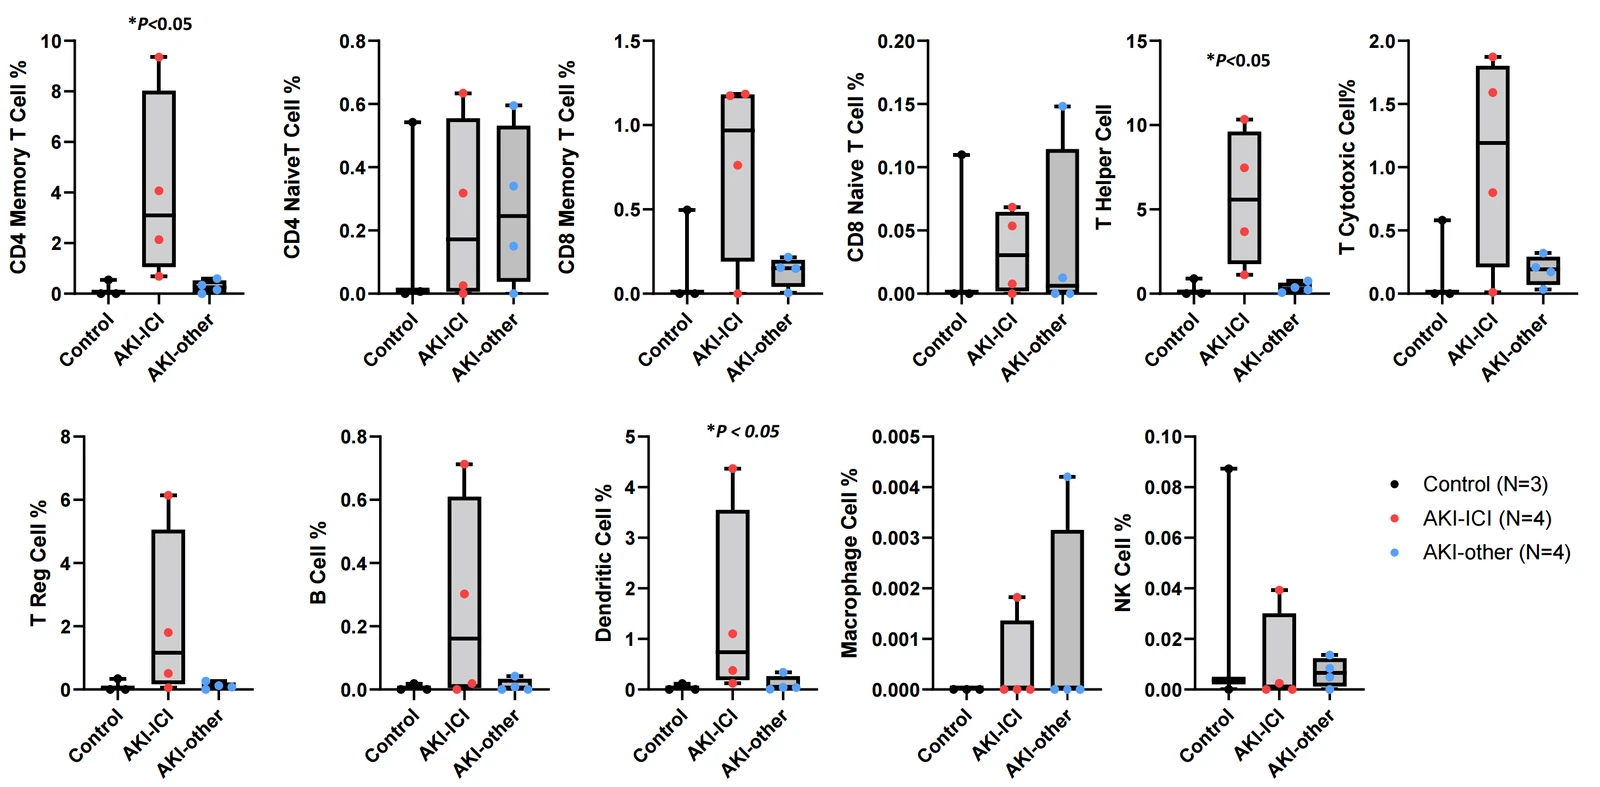
Kidney biopsies were profiled with a 26-marker imaging mass cytometry panel: spatial immune-cell phenotyping across renal compartments, cell colocalization scoring and unsupervised UMAP analysis.
Outcome
Affected kidneys showed a distinct immune microenvironment with more CD4 memory T cells, T helper cells and dendritic cells. Alongside these findings, TNF-α emerged as a strong discriminatory biomarker (AUC 0.814).
Mass spectrometry images of lipid metabolites across a tumour margin

Mass spectrometry imaging · image analysis

A gradient of cancer-like metabolism beyond the tumour margin

Analytical Chemistry, 2021

Challenge
Is brain tissue just outside a medulloblastoma's histologic margin metabolically normal?
Approach
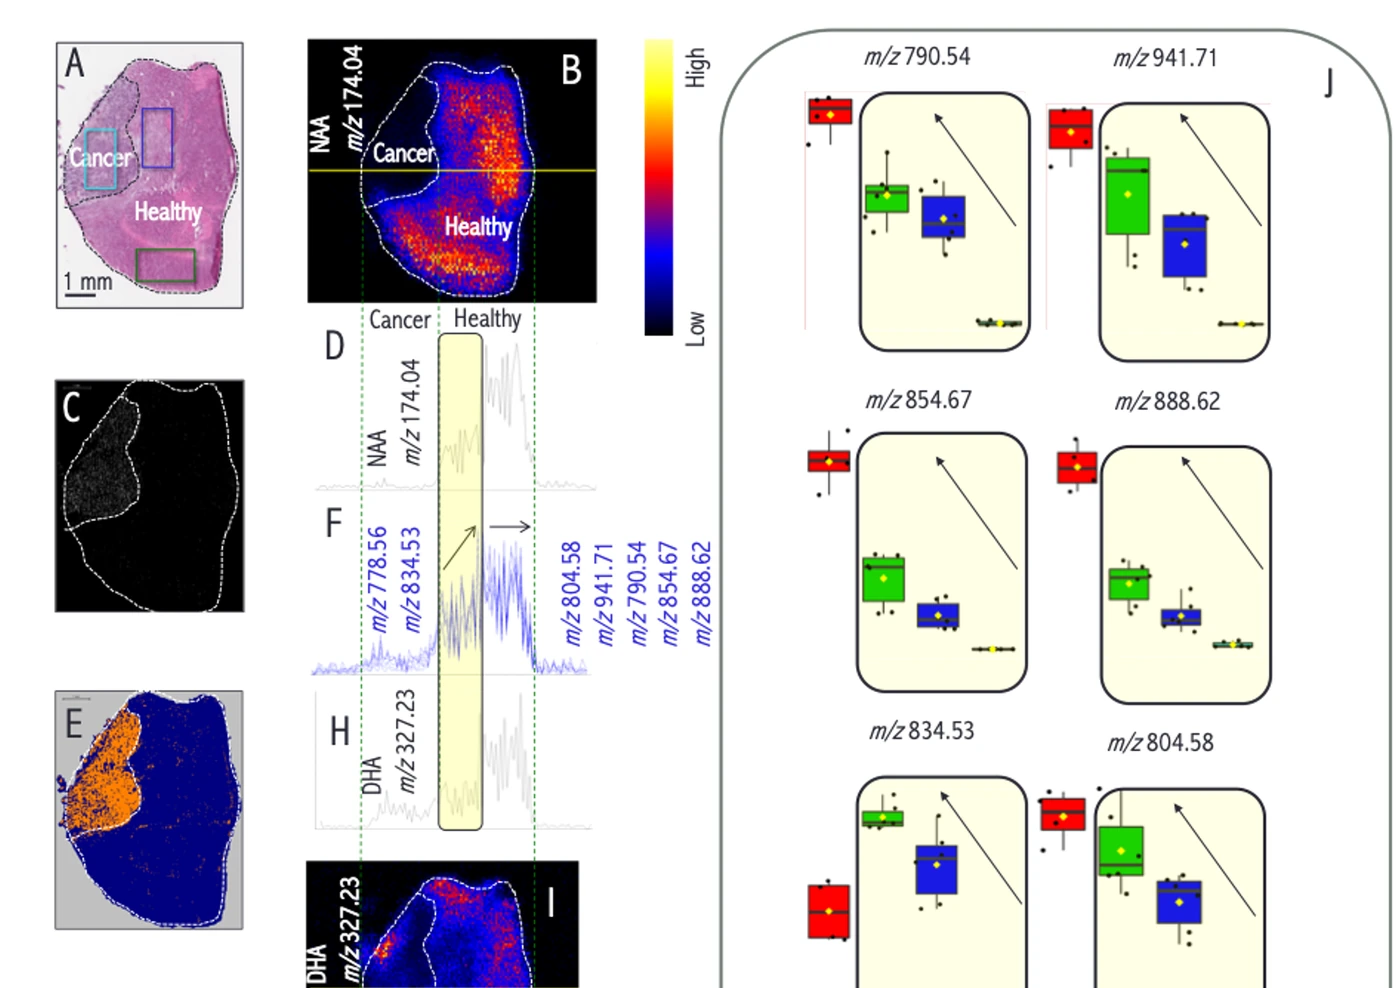
Mass spectrometry imaging mapped lipid metabolites in tissue adjacent to the tumour, and computational image analysis compared tumour, margin and healthy regions spatially.
Outcome
The analysis revealed a gradient of cancer-like metabolic states extending beyond the histologic tumour margin, in regions previously considered normal.
Hypoxia and proliferation gradients relative to blood vessels in tissue

Multiplex immunofluorescence · computational pathology

Measuring hypoxia as a gradient, not a yes-or-no

Frontiers in Bioengineering and Biotechnology, 2019

Challenge
Tumour hypoxia is a continuous spatial gradient, yet most image analysis pipelines treated it as binary.
Approach
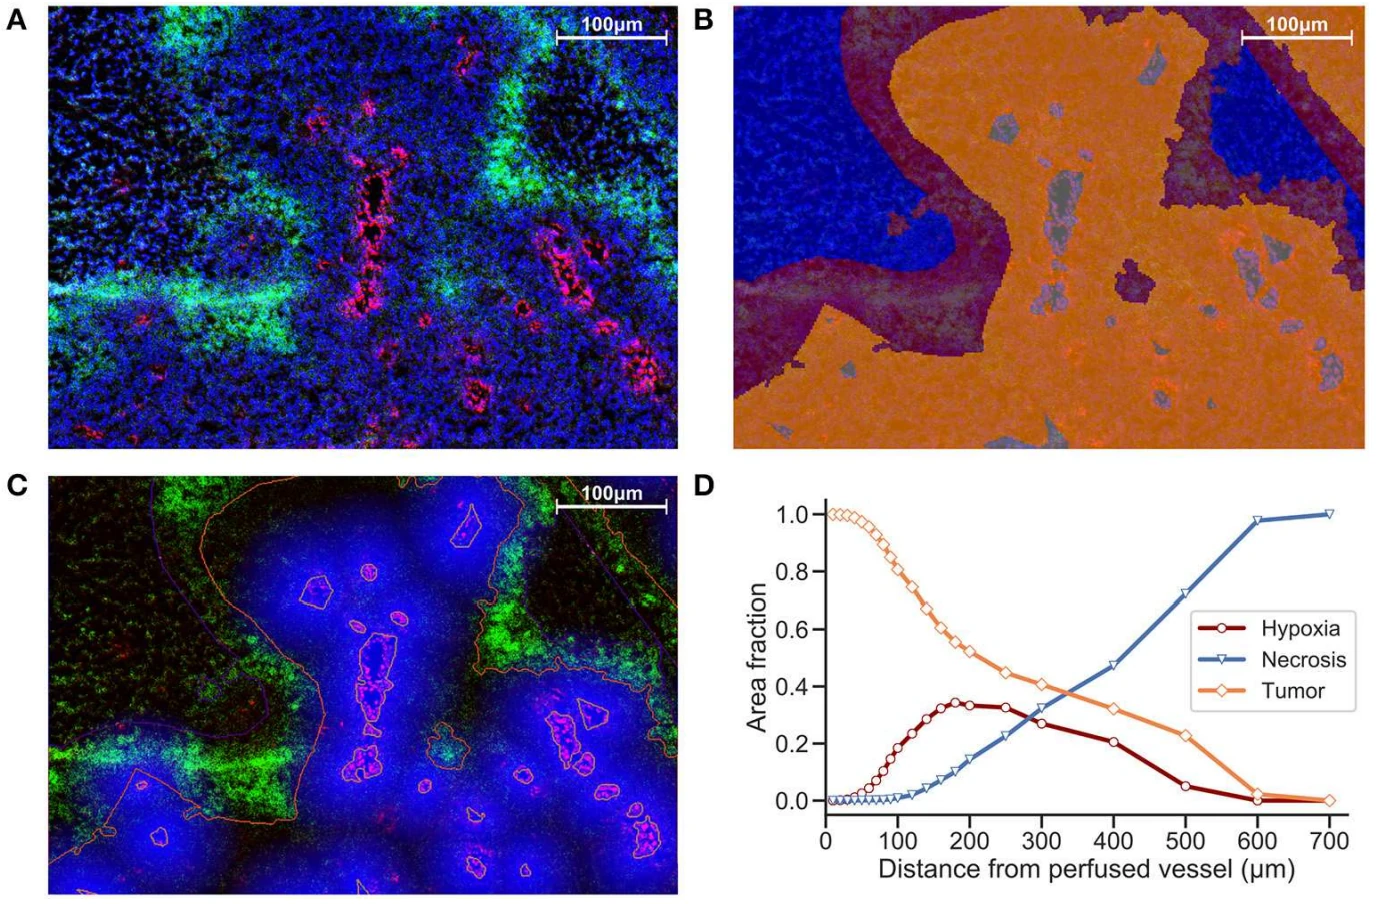
A reproducible pipeline combined cell segmentation, distance-to-vessel analysis and spatial scatter plots to quantify hypoxia and proliferation in multiplexed immunofluorescence sections at single-cell resolution.
Outcome
Hypoxia and proliferation gradients could be related to perfused blood vessels, giving insight into oxygen diffusion and tumour heterogeneity. The approach became a foundation for later spatial and multiplex work.

Quantitative image analysis · preclinical models

Imaging readouts for a hypoxia-activated prodrug

JCI Insight, 2018

Challenge
Evofosfamide (formerly TH-302), a hypoxia-activated prodrug, was being evaluated for HPV-negative head and neck squamous cell carcinoma, a cancer where hypoxia drives treatment resistance.
Approach
Quantitative image analysis and segmentation measured the drug's effects in tissue, forming the imaging component of the study.
Outcome
Evofosfamide showed strong preclinical efficacy across cell lines and xenograft models, with early signs of clinical activity in advanced disease.

Label-free imaging · deep learning

Finding ALS phenotypes in label-free images of motor neurons

ISSCR 2026 poster, with Institut Imagine (Paris)

Challenge
Could ALS-associated changes in iPSC-derived motor neurons be detected from live, label-free phase-contrast images, with no staining at all?
Approach
The MONDRIAN pipeline combined deep learning segmentation with supervised object classification to extract more than 150 morphometric features per cell, applied to over two million classified objects from TARDBP and C9orf72 ALS cultures.
Outcome
The pipeline accurately discriminated ALS from control cultures at the image level, from morphology alone.

Have a project like these?

Share your modality, project stage and question, and we'll suggest the right analytical next step.